Equipment uptime and first-time fix you can actually defend
Field Ascend measures equipment uptime from the live status timeline, then proves first-time fix from the same asset history. Office reports, engineer credit and customer portal KPIs all read one set of facts.
Short answer: equipment uptime is in-service hours divided by classified hours in the window you pick. A first-time fix is only counted when a reactive job put a down asset back in service on the first visit, with no same-day relapse and no return visit.
If the timeline cannot prove it, the job is marked Can't verify and left out of the percentage. That is slower to look pretty and much harder to argue with in a contract review.
Guessed uptime loses contracts
Facilities managers and multi-site buyers now ask for asset uptime, first-time fix and attendance windows in the same breath as price. A lot of field service management software still answers with a spreadsheet export, a completed-job count, or “one visit day equals a fix”.
That last one is the trap. An engineer can visit once, leave the plant room still failed, and the job still looks like a first-time fix because nobody went back. Your customer already knows the lift, boiler or AHU was down again at 4pm. The report that ignores that fact does not survive a quarterly review.
Field Ascend ties the number to the same equipment register your engineers already update on the mobile app. Status flips become timed segments. Labour times become the visit window. The report is the history, not a separate KPI project.
Fleet and per-asset uptime
Last 30 days, 90 days, last month, this year or a custom range. Filter by customer and site. Sort worst assets first.
Proven first-time fix
Reactive jobs only. Out of service at arrival, restored on the first visit, no bounce-back that day. Unprovable jobs stay out of the %.
Engineer credit
Credit the person who flipped the asset in service. Never guessed from the crew list or the timesheet row.
Customer portal KPIs
Opt-in cards for uptime, first-time fix, SLA attendance, top failing assets and downtime hours. Off until you switch them on.
How equipment uptime is measured
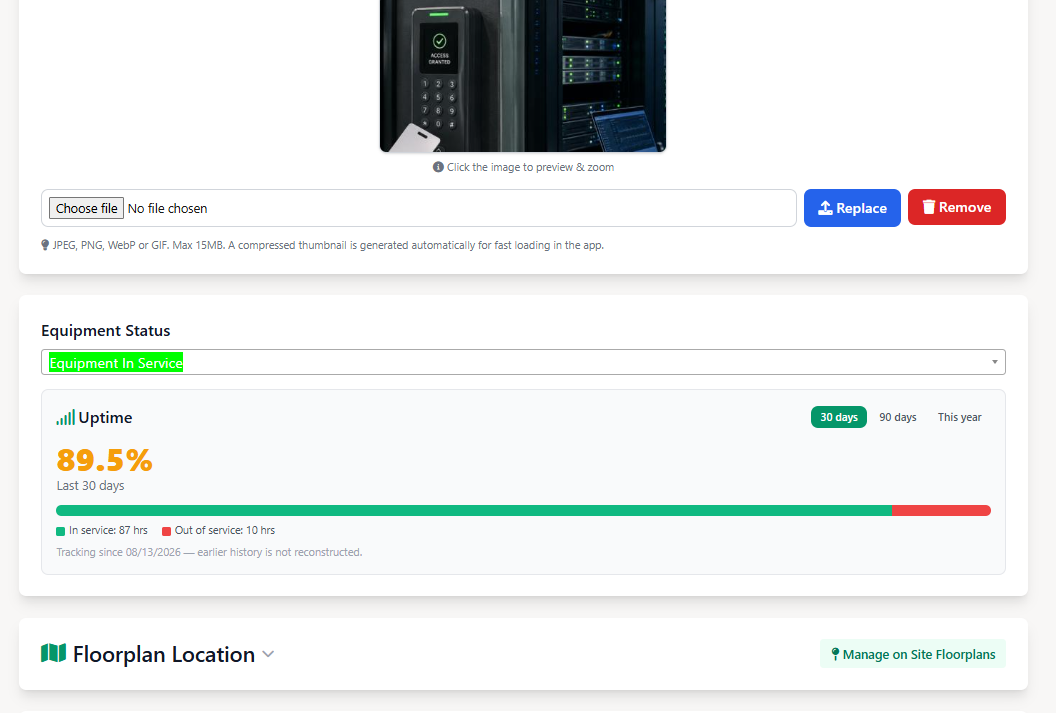
Uptime is not stored as a percentage. It is calculated when you open the report, from an append-only status timeline. When an engineer or the office changes equipment status, that change starts a segment. The next change (or “now”) ends it.
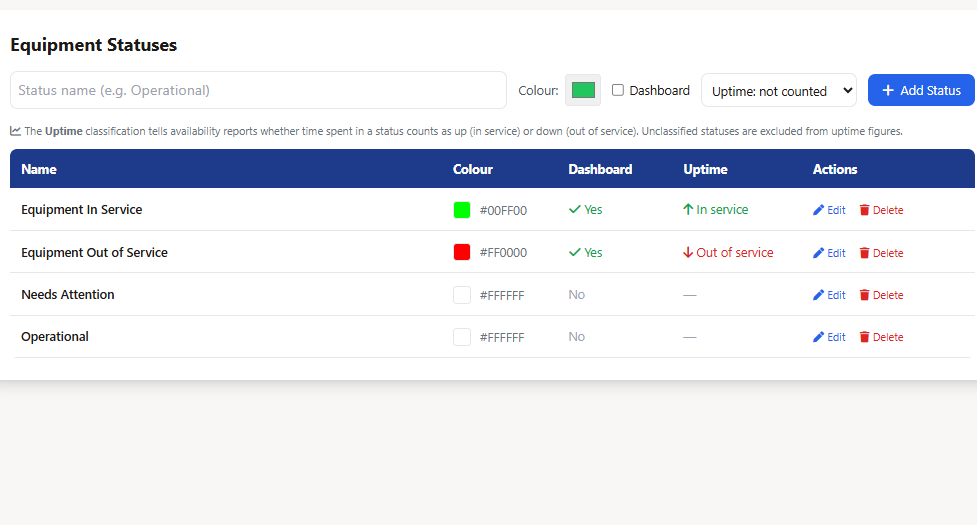
Each of your operational statuses is classified in Equipment Setup as in service, out of service, or not counted. Spares, decommissioned kit and odd custom statuses can sit in “not counted” so they do not drag a live fleet number down.
Hours with no classified status are ignored. A 90-day window only uses time inside that window. Tracking starts at the first log row after go-live. We do not invent a year of history so a new tenant looks “always 99%”.
That same engine feeds the optional uptime columns on the equipment list (30 / 60 / 90 / all, off by default) and the 30 / 90 / year-to-date card on the equipment record. AI dashboard tiles can show fleet uptime for those periods without anyone writing SQL interval maths.
Classify every live status. Unclassified statuses are left out of the uptime maths on purpose.
The admin Equipment Uptime report
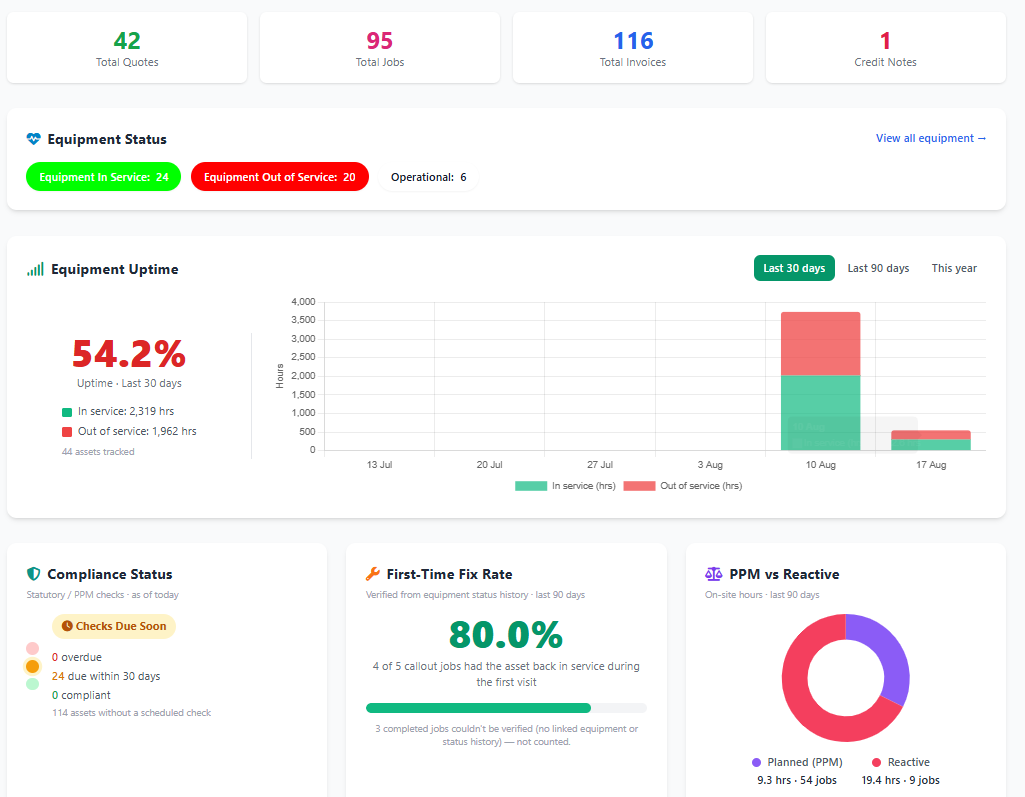
Reports → Equipment Uptime is the office view. Date chips, customer and site filters, then four cards: fleet uptime %, in-service hours, out-of-service hours, and how many assets are actually being tracked. Under that, a stacked bar of green and red hours by day, week or month. The table lists each asset worst-first: ref, description, site, customer, current status, uptime %, hours, and tracking-since date. CSV export includes the UTC window so a contract pack is easy to attach.
Colour is blunt on purpose. 98% and above reads green, 90–97% amber, below 90% red. If statuses are still unclassified, a banner points you at Equipment Setup instead of silently cooking a fake 100%.
Fleet uptime, hours in and out of service, and the assets dragging the number down.
Proven first-time fix, not “one visit day”
First-time fix is the KPI buyers quote and almost nobody defines. Field Ascend uses a proven test on completed reactive jobs. Planned PPM visits are out of scope. If you have mapped breakdown categories in Job Options, only those jobs count. If you have mapped nothing, every non-PPM job is treated as reactive, which is a documented fallback, not a silent default you should leave forever.
For a job to count as proven, all of this has to hold:
Must be true
Equipment is linked to the job
There is a recorded on-site visit
Only one labour date (a second day fails it)
Each asset that was out of service at arrival flips in service in the first-visit window (onsite start to last onsite end, plus a one-hour buffer)
It does not go back out of service before midnight that day
Can't verify never sits in the denominator. That keeps a new tenant, or a week where engineers forgot to flip status, from looking like a miracle or a disaster. The report still shows the unprovable count so you can coach the process.
The admin First-Time Fix report (default 90 days) shows the fleet %, fixed-first-visit count, not-first-time count, and Can't verify. Under that, engineer credit: attended verifiable callouts, credited fixes, credit rate. Credit is only written when the in-service flip was stamped as that engineer. Actor tracking on those flips started 15 August 2026, so older log rows can prove a fleet fix and still credit nobody. That is honest, not a bug.
Proven %, failed, Can't verify, and who actually restored the asset.
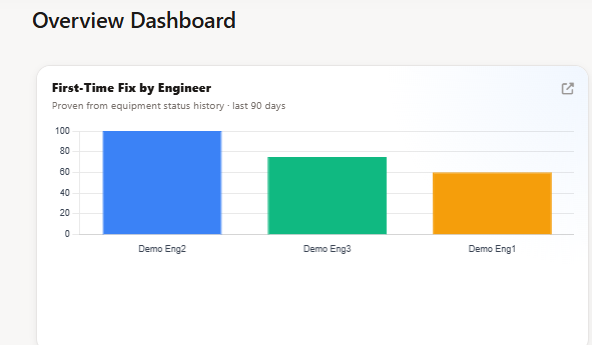
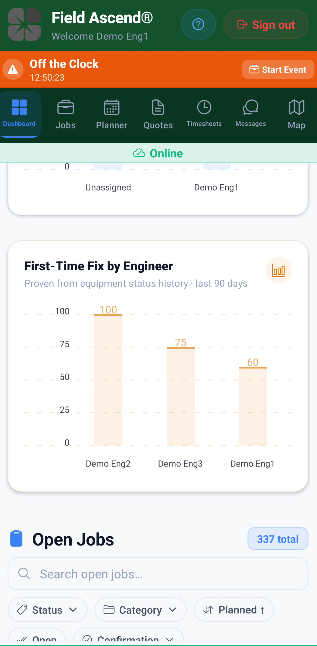
The same proven rate can sit on the field service app dashboard as a First-Time Fix by Engineer tile. Supervisors see last-90-day credit rates without opening the office report. The bars still come from the status timeline, not from a one-visit count.
App dashboard KPI: first-time fix by engineer, proven from equipment status history.
Customer portal KPIs, switched on when you are ready
Commercial clients do not want another PDF. They want a login that matches the contract pack you already promised. The customer portal can show the same uptime engine and the same proven first-time fix card, scoped to that customer’s sites only.
Every analytics card is off by default under Setup → Customer Options. You pick the window (90 days is the usual start), the SLA hour bands (default 4, 10, 24, 48), how many failing assets to list, and an optional downtime £/hour if you want a cost line. Nothing is invented for “ROI”.
Uptime vs downtime
Giant % plus in/out hours and a stacked chart, with 30 / 90 / year-to-date toggles. Empty until tracking has something to show.
First-time fix rate
Same proven definition as the office report. Shows X of Y callout jobs and the unprovable footnote.
SLA attendance
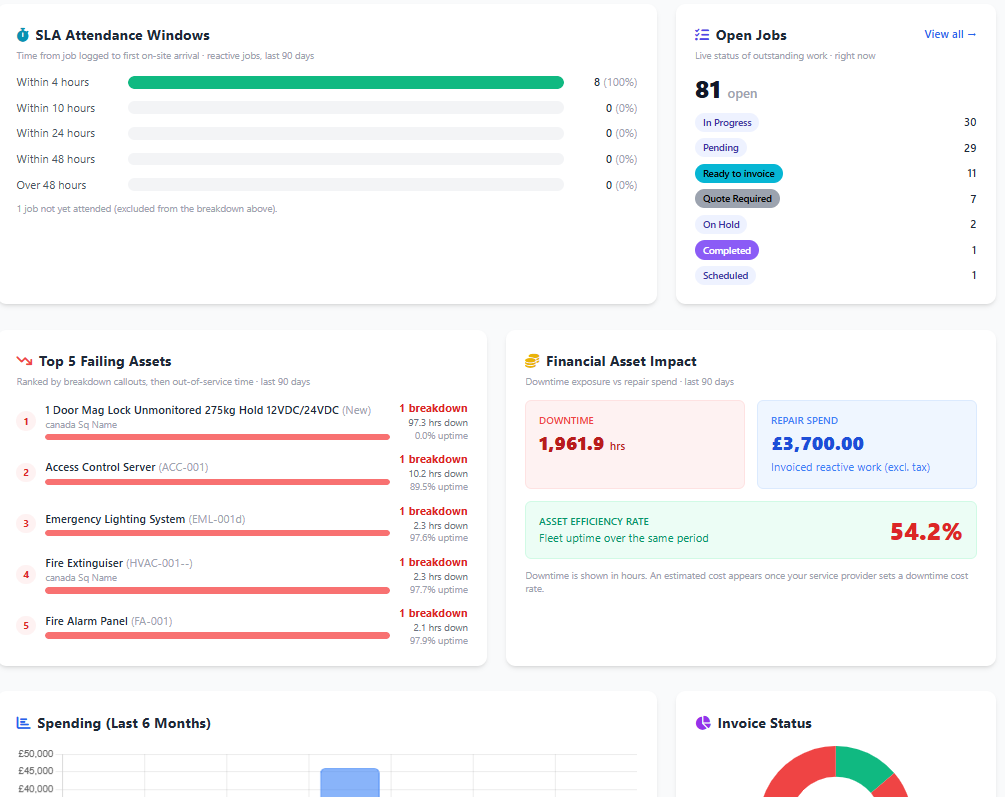
First on-site arrival minus job created time, bucketed into your hour bands, reactive jobs only. Display analytics, not a contractual breach engine.
Failing assets and spend
Top assets by breakdown job count, downtime as the tie-break. Financial card compares downtime hours with posted reactive invoice spend.
The client sees their estate only. You decide which cards are live.First-time fix, attendance bands and the assets causing the callouts, in one portal.
What you set up before the numbers mean anything
This is the part most marketing pages skip. The maths is only as good as the status discipline.
Classify every operational status in Equipment Setup. Map breakdown / reactive categories in Job Options so PPM and callouts are not mixed. Link equipment on breakdown jobs. Get engineers to flip status on site: out of service when it is failed, in service when it is running. Then wait. A week of flips is more useful than a backfilled fantasy year.
Engineers do not see an uptime percentage in the app. Their job is the flip. The office and, if you switch it on, the customer see the report. That split keeps the field workflow short and still gives you a KPI you can stand behind.
Where this sits next to PPM, CAFM and the register
Uptime does not replace planned preventive maintenance. PPM is how you stop the next failure. Uptime is how you prove the last one. Pair the two with QR code asset tracking so the engineer is flipping the right asset, not a nearby lookalike.
Multi-site facilities buyers will still look at CAFM software and maintenance management software. Field Ascend is the contractor-side system: jobs, engineers, the register, then these KPIs on top. HVAC, electrical, plumbing and lift contractors use the same engine because the status timeline does not care which trade restored the asset.
FAQ
How does Field Ascend calculate equipment uptime?
From the status timeline. In-service hours over classified hours in the window you pick. Unclassified time is excluded. No pre-go-live history is invented.
What is a proven first-time fix rate?
A reactive job that restored a down asset on the first visit, with no same-day relapse and no return visit. Can't verify jobs stay out of the percentage.
Can customers see these KPIs?
Yes, on the customer portal, per card, off by default. They only ever see their own sites and equipment.
Who gets first-time fix credit?
The engineer who changed the asset to in service. The report does not guess from the job crew.
Is this the same as the asset register?
No. The register is what you look after. These reports are how often it stayed in service and whether the first visit put it back.
Do you calculate mean time to repair?
Not yet. The live metrics are period uptime, downtime hours and proven first-time fix. If a buyer asks for those averages, start with the timeline you already have rather than a guessed spreadsheet.
Show customers a number you can stand behind
Start a trial, classify your statuses, and let a week of real flips build the first uptime and first-time fix report. From £10 per user per month after the 30-day trial.