Equipment uptime measures the percentage of required operating time that an asset was operational.
Uptime (%) = Operating time ÷ Required operating time × 100
Field Ascend does not ask you to type a monthly hour budget. It fills both sides from classified asset-status history. Operating time is in-service hours. Required operating time is in-service plus out-of-service. Hours you have not classified stay out of both sides.
What is equipment uptime?
Uptime is running time in a date window, not a green badge on the asset register. A passenger lift can be in service at 9am and still have been down for 11 hours last month. The facilities manager remembers the 11 hours. A snapshot does not.
That is why a last-known status is a poor KPI. It answers “is it running now?”. The question on a CAFM review is “how much of the time we needed it did it actually run?”
Equipment uptime formula
The conventional formula is the one most search results quote, and it is the right place to start:
Uptime (%) = Operating time ÷ Required operating time × 100
Operating time is the hours the asset could do its job. Required operating time is the hours you expected it to be able to. Get those two wrong and the percentage is theatre.
Field Ascend derives the same two numbers from the status timeline your engineers already update. Every flip writes a time. The hours until the next flip (or until now) belong to that status. You classify each operational status as in service, out of service, or not counted.
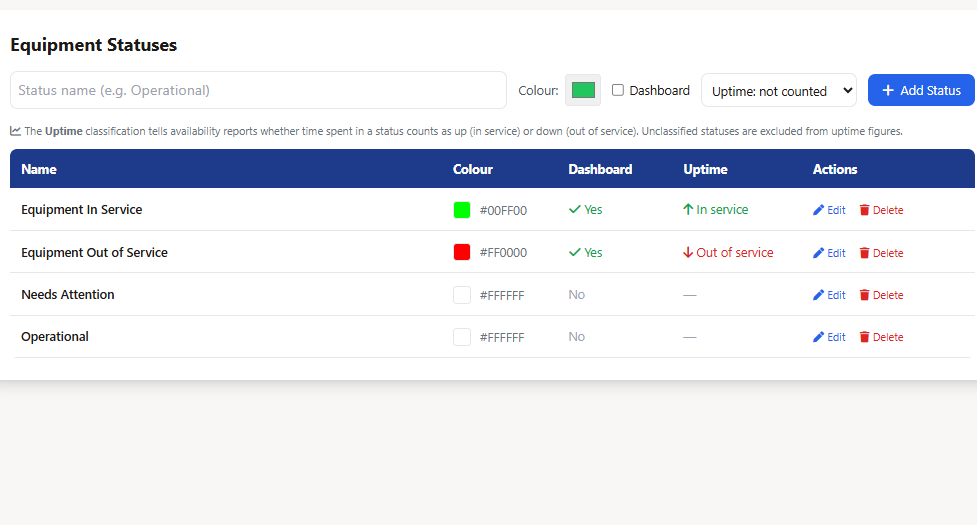
Uptime % = in-service hours / (in-service hours + out-of-service hours) × 100
If the classifications match the contract (nights excluded, spare kit excluded, breakdowns counted as down), both formulas produce the same percentage. The second one is how the hours are actually collected. The first one is how you explain it in a meeting.
Equipment uptime calculation example
Simple example. A boiler is required 24 hours a day for a 30-day month. Required operating time is 720 hours. It is down for 24 hours after a callout. Operating time is 720 − 24 = 696 hours.
Uptime = 696 ÷ 720 × 100 = 96.7%.
That is the GCSE version. It assumes you already know which hours were required and which hours were down. On a live fleet you rarely have a tidy 720. You have status changes, unclassified leftovers, and assets that were not even logged until August.
Status-history example. A rooftop AHU is in service for 86 hours in a week, out of service for 10 hours after a callout, and sits on an unclassified “awaiting parts” status for 8 hours because nobody decided how that status should count.
Classified time is 96 hours. Uptime is 86 / 96 = 89.6%. The 8 unclassified hours are ignored, not treated as up and not treated as down. Guessing those 8 hours as “up” is how 99% dashboards get born.
What time should be included in the calculation?
The denominator is where most teams go wrong. Decide this in writing before you publish a number.
- Planned operating time: the hours the site actually needed the asset. A school boiler at 2am may be outside required time. A hospital generator is not.
- Planned exclusions: mothballed plant, spare kit, decommissioned units, awaiting install. Classify those statuses as not counted so they never enter the sum.
- Downtime: failed, isolated, awaiting parts if the asset cannot run. That is out of service, whether the stop was planned or a 3am breakdown.
- Unknown data: a status exists and nobody classified it. Leave those hours out. Do not guess them as up to fatten the percentage.
Planned versus unplanned is a reason, not a second formula. A planned shutdown during hours the site needed the asset still reduces uptime. A planned exclusion (nights, spare on the rack, summer mothball) should sit outside required time. If you argue about this after the review meeting, you never classified the statuses.
Equipment uptime vs downtime
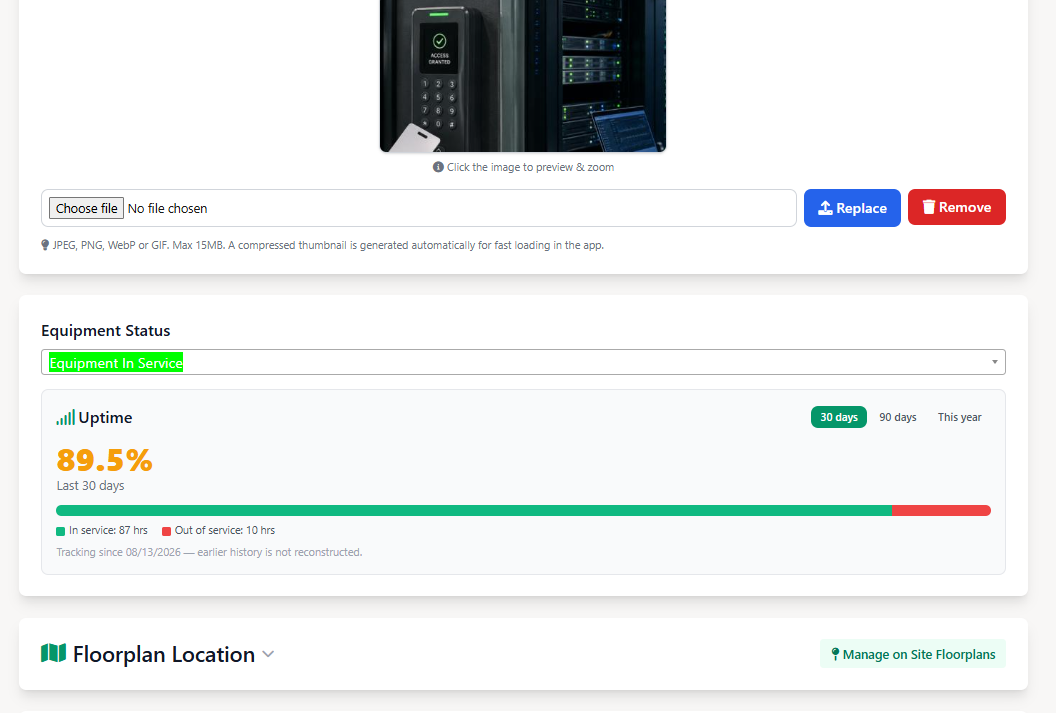
Downtime % = out-of-service hours ÷ the same classified hours × 100. Used honestly, uptime and downtime add to 100%.
They stop adding up when one chart uses classified hours and the other uses calendar hours. You then get “97% uptime” next to “80 hours of downtime” that cannot both be true. Pick one denominator and stick to it on the report and in the customer portal.
Equipment uptime vs availability
Search results treat these as neighbours, and in everyday field service people use the words as synonyms. That is fine in a toolbox talk. It is not fine in a reliability textbook.
Textbook availability is usually MTBF / (MTBF + MTTR). That needs failure intervals and repair durations. Field Ascend does not calculate MTBF or MTTR, and this page will not pretend otherwise.
If a contract says “available during occupied hours”, that is still uptime with a tighter required-time window: exclude nights and weekends from the denominator. Do not invent a second KPI named availability unless you also invent the MTBF maths.
How to measure uptime accurately across multiple assets
Do the hours per asset first, then add them. Fleet uptime is total in-service hours divided by total classified hours. Do not average percentages. Ten assets at 99% and one at 40% is not “about 93%” if the 40% unit is the hospital generator. Hour-weighted fleet uptime is the number that matches the pain.
Start the clock at the first real status log. A new system should not pretend January to July was 100% because you imported a register in August. PPM software can still show planned visits for that older period. Uptime should not.
Why asset status history matters
A traffic light tells you the last status. A timeline tells you the hours. Without the flips, you are back to “it is in service right now”, which is how contractors lose arguments with facilities managers who were in the plant room last Tuesday.
That timeline is also what makes a first-time fix claim testable. You cannot prove a restore from a completed job row. You can prove it from “out of service at arrival, in service before the engineer left, no same-day relapse”.
How first-time fix affects equipment uptime
A failed first visit leaves the asset out of service for longer. That is extra downtime in the uptime formula. Proven first-time fix is the restore on visit one, not a completed job with one labour date.
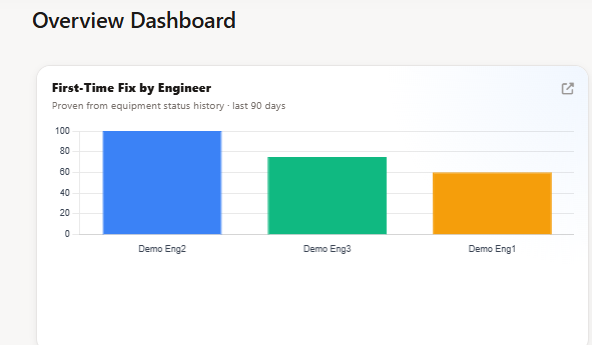
Use completed reactive jobs only. Then the job needs equipment linked, a recorded on-site visit, one labour date, every asset that was down at arrival flipped in service inside the first-visit window, and no bounce back out of service before midnight. Jobs you cannot prove stay in Can't verify, outside the percentage.
First-time fix % = proven / (proven + failed) × 100
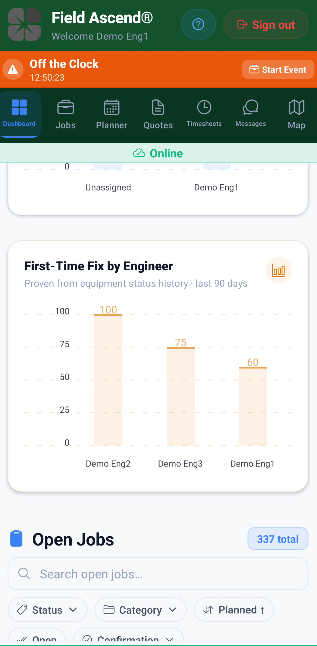
Credit the person who flipped the asset to in service, not whoever is primary on the job card. That same 90-day credit can sit on the field service app dashboard. If engineers still pick the wrong asset from a long list, QR code equipment tracking is the boring fix that shrinks Can't verify.
How to improve equipment uptime
The formula does not raise itself. The hours move when the work changes.
- Put PPM on the assets that actually fail, not on every serial number you can print a sticker for. Top failing assets, ranked by breakdown jobs with downtime as the tie-break, tell you where to start.
- Get someone on site faster. A 96% first-time fix that arrived at hour 47 still spent those 47 hours out of service.
- Carry the part. A first visit that stops at “awaiting parts” is extra out-of-service time you already paid to attend.
- Finish the restore on the first visit when you can. That is the first-time fix test above, used as an ops habit, not as a slogan.
Shorter repair time helps uptime. Field Ascend does not ship an MTTR or MTBF report, so do not put those labels on a client pack until you have a separate calculation you can defend.
What to put in front of the customer
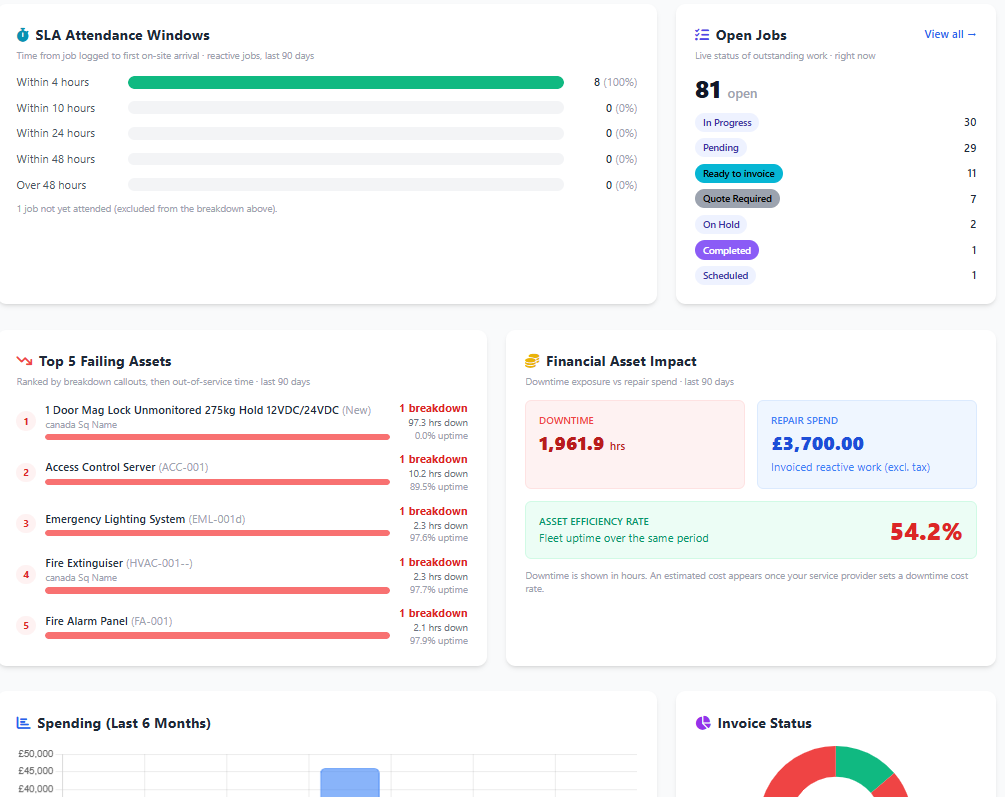
A branded customer portal is the right place once you trust a month of data. Start with uptime versus downtime for their sites. Add first-time fix when Can't verify has dropped. Keep the cards off until statuses are classified. An empty chart in week one is fine. 100% because nothing was classified is not.
A week-one setup that does not lie
Monday: classify statuses. Tuesday: map breakdown categories so PPM and callouts stay apart. Wednesday: tell engineers the two flips that matter (failed = out of service, running = in service). Thursday: check a handful of jobs have equipment linked. Friday: open the 30-day uptime report and accept that it will look thin.
By week four you have a story. By quarter-end you have a pack. HVAC, electrical, plumbing and lift work all use the same rules because the asset either ran or it did not. The trade is in the job. The KPI is in the timeline.
The product view of the same engine (admin report, engineer credit, portal cards) lives on equipment uptime and first-time fix software.
FAQ
How do you calculate equipment uptime?
Operating time divided by required operating time, times 100. In Field Ascend that is in-service hours divided by classified hours. Ignore unclassified statuses. Do not backfill history you never logged.
What is the difference between uptime and availability?
Everyday speech treats them as the same. Textbook availability uses MTBF and MTTR, which we do not calculate. If the contract means occupied hours only, tighten the denominator. Do not invent a second number.
Should planned downtime count against uptime?
Yes, if those hours were required operating time. No, if you classified them as not counted (nights, spare, mothballed). Decide before the review, not after.
How do you measure uptime across a fleet?
Add the hours. Do not average the percentages.
How does first-time fix affect uptime?
A failed first visit stretches out-of-service hours. Proven first-time fix is a related KPI, not a replacement for the uptime formula.
How soon are the figures useful?
After statuses are classified and engineers start flipping them. Use 30 days for a first look, 90 days for a client pack.